

VedronERP · Analysis & Reports
Sales Analysis
The Analysis page gives you sales and profit reports in tabs. Set the period and filters once, then switch tabs to look at the same data from different angles.
Accessing Analysis
- Go to the Dashboard and click "Analysis" under Reports & Analysis.
- Choose a "Quick Filter" (Last 30 days, Last 90 days, This Year, Last Year, Last 2 Years, All Time) or "Custom" and set the date range.
- Optionally narrow the data by "Company" and "Manufacturer", and choose the "Period" (Monthly, Quarterly or Yearly) for trend views.
- Click "Apply Filters".
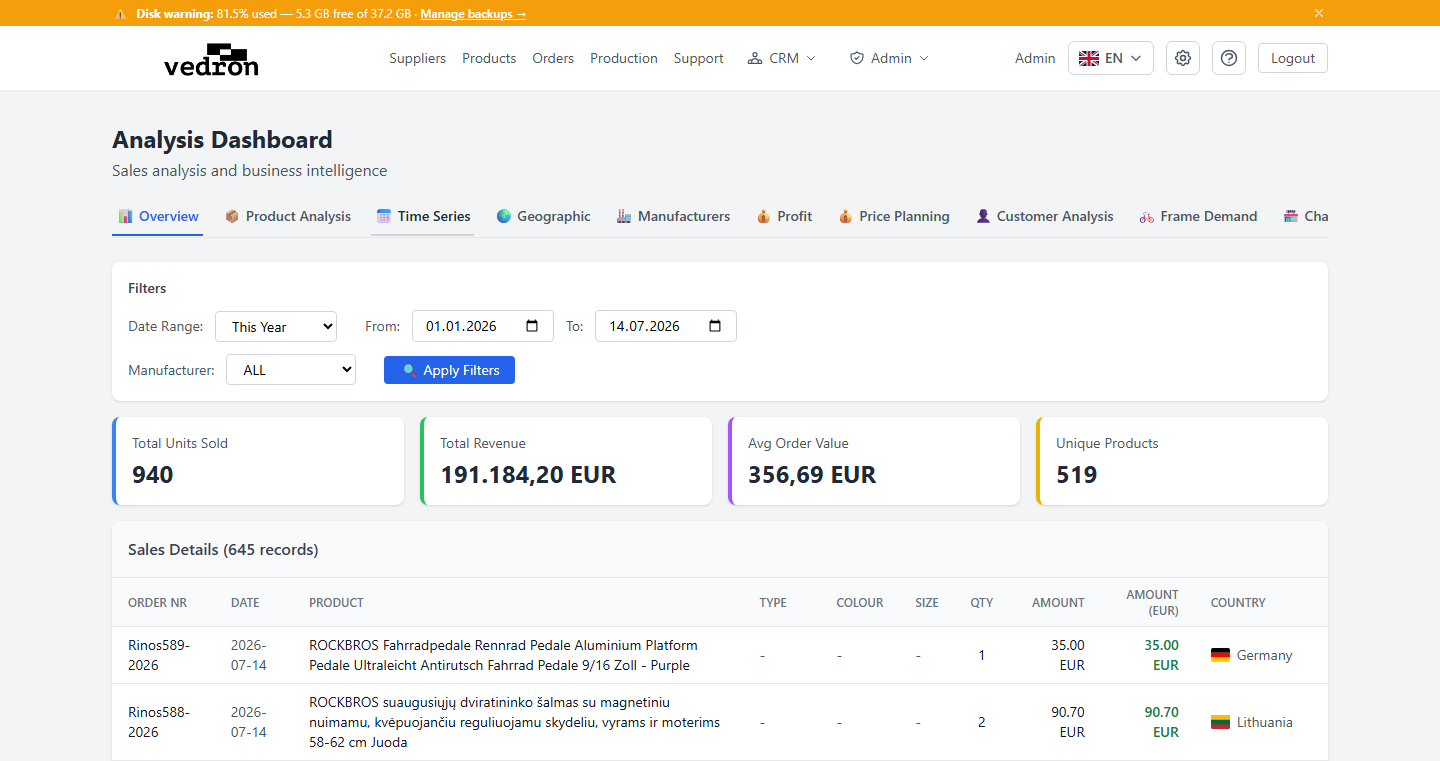
The tabs
- Overview — totals such as units sold, revenue, average order value and unique products, plus the individual sales records.
- Product Analysis — sales per product.
- Time Series — the trend per month, quarter or year.
- Geographic — sales by country.
- Manufacturers — a comparison of your manufacturers.
- Profit — net sales, cost price, profit and profit margin.
- Price Planning and Channel Mix — see 12.4 and 12.3.
- Customer Analysis — search customers by name or company and analyse the ones you select.
- Demand Forecast — a monthly demand projection by product type, based on last year's seasonal pattern, with an adjustment you can apply.
- Inventory Value — the value of your stock.
Tip: Profit needs cost prices. Lines whose product has no cost price are flagged, because they can skew the profit figures.